You posted all month. Now prove it worked.
You scheduled the posts. The follower count moved. Which post moved it? Northfact publishes to Instagram, Facebook and Threads and then measures what each one earned: Instagram analytics with the source and the denominator printed beside every figure, so you can tell an answer from a confident guess.
Two engagement rates for the same post. Both correct.
One tool divides the engagements by the people who saw the post. Another divides them by the people who follow the account. The two answers are rarely close, neither tool says which one it did, and one of them ends up in a report that goes to somebody who trusts you.
The same engagements, over two different crowds
Reach and followers are different counts and usually differ by a lot. A rate worked out against one of them cannot be compared with a rate worked out against the other, so putting the two in one table makes a comparison that is not true. Every rate here carries the crowd it was measured against, and a competitor is only ever compared like for like.
And where there is no number, a gap
Meta removed reach and impressions for Facebook Page posts and serves nothing in their place. A tool that fills that cell with an estimate has invented a measurement and told you nothing about it. This one leaves the cell empty and prints the reason, because a blank you can explain is worth more than a figure you cannot.
Northfact prints what a figure was measured against beside the figure, every time, so the question never has to be asked.
The long version, with the four reasons two tools report different numbers for one post: Why your analytics tool disagrees with the Instagram app.
Knowing a number is wrong is not the same as having the right one. So what does the right one look like
Three steps, and the third is the one nobody else finishes
Connect your accounts
Sign in with the accounts you manage. Northfact reads what those platforms make available to you and nothing beyond it.
Plan and publish
Draft, queue and schedule across your channels from one calendar, with each post tracked from the moment it goes out.
Find out what it earned
Get performance and benchmarks in one report, every number labelled by where it came from and every gap named rather than filled in. Send it on, or just act on it.

That is the shape of it. It is easier to believe as a picture. See the workspace
Look at it before you believe any of this
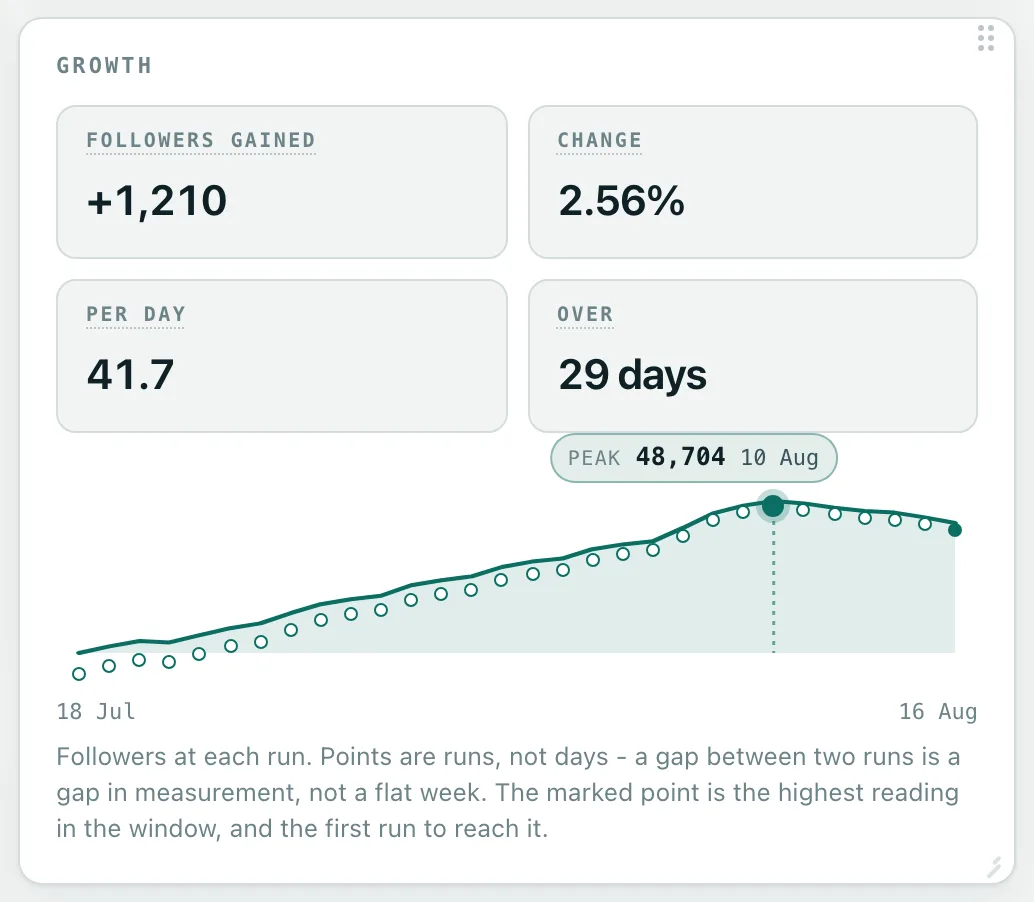
Two more screens from the beta as it stands today, one at a time - captured from the app rather than drawn in a design tool, and the card at the top of the page is off a third. The figures are from a demo account; the layout, the wording and the line under every chart saying what it was measured against are exactly what you get.
-
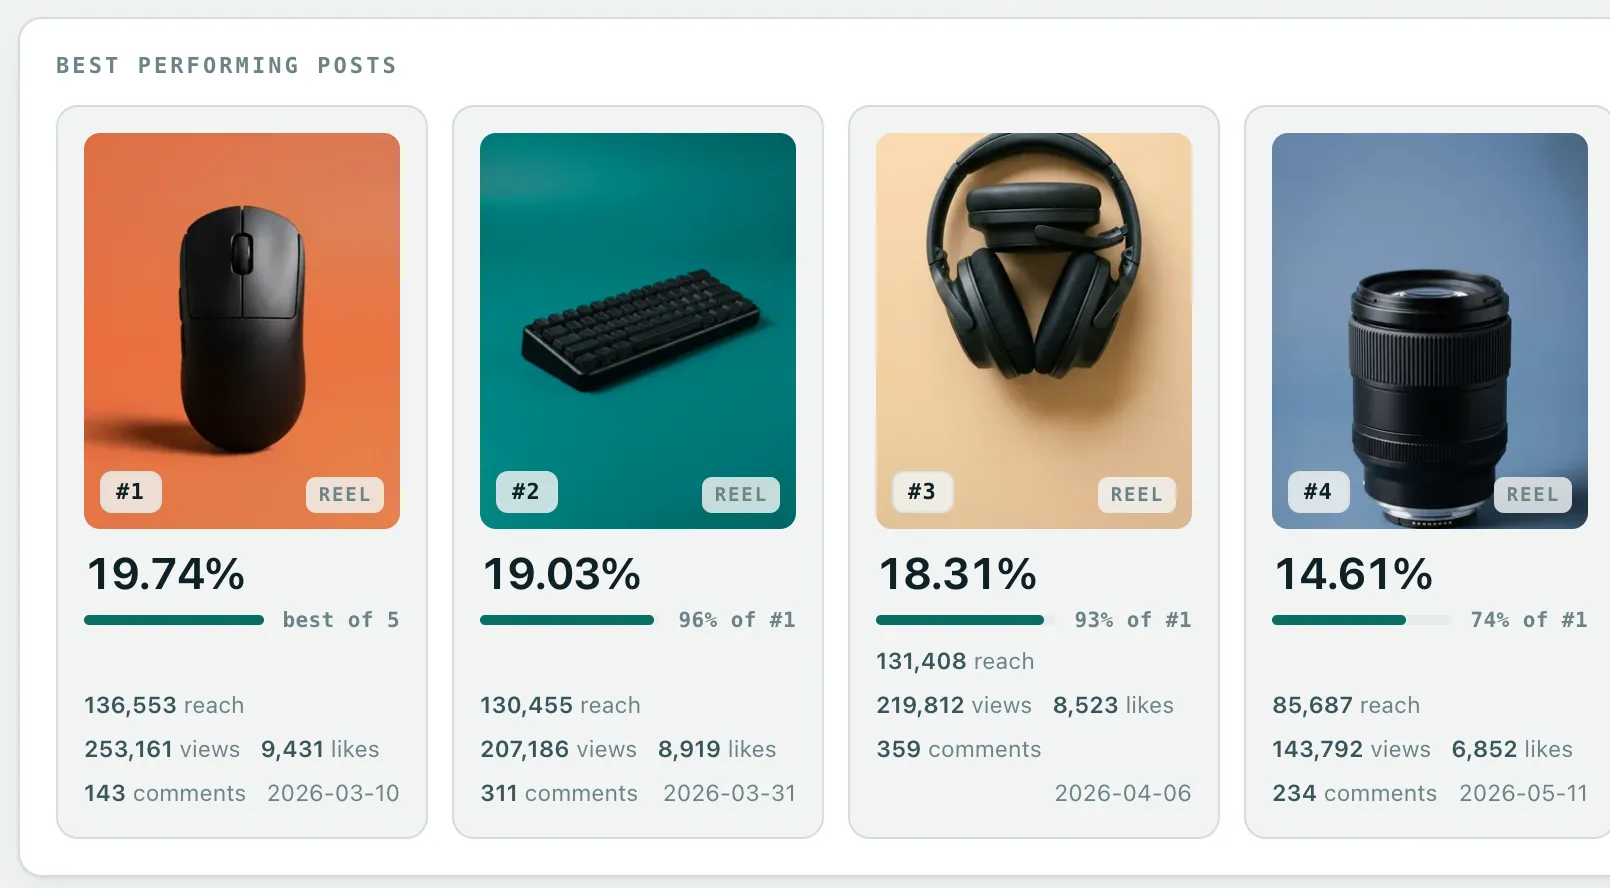
Content. Your posts ranked by the engagement they actually earned, each one carrying the format it went out as and how it did against your best. -
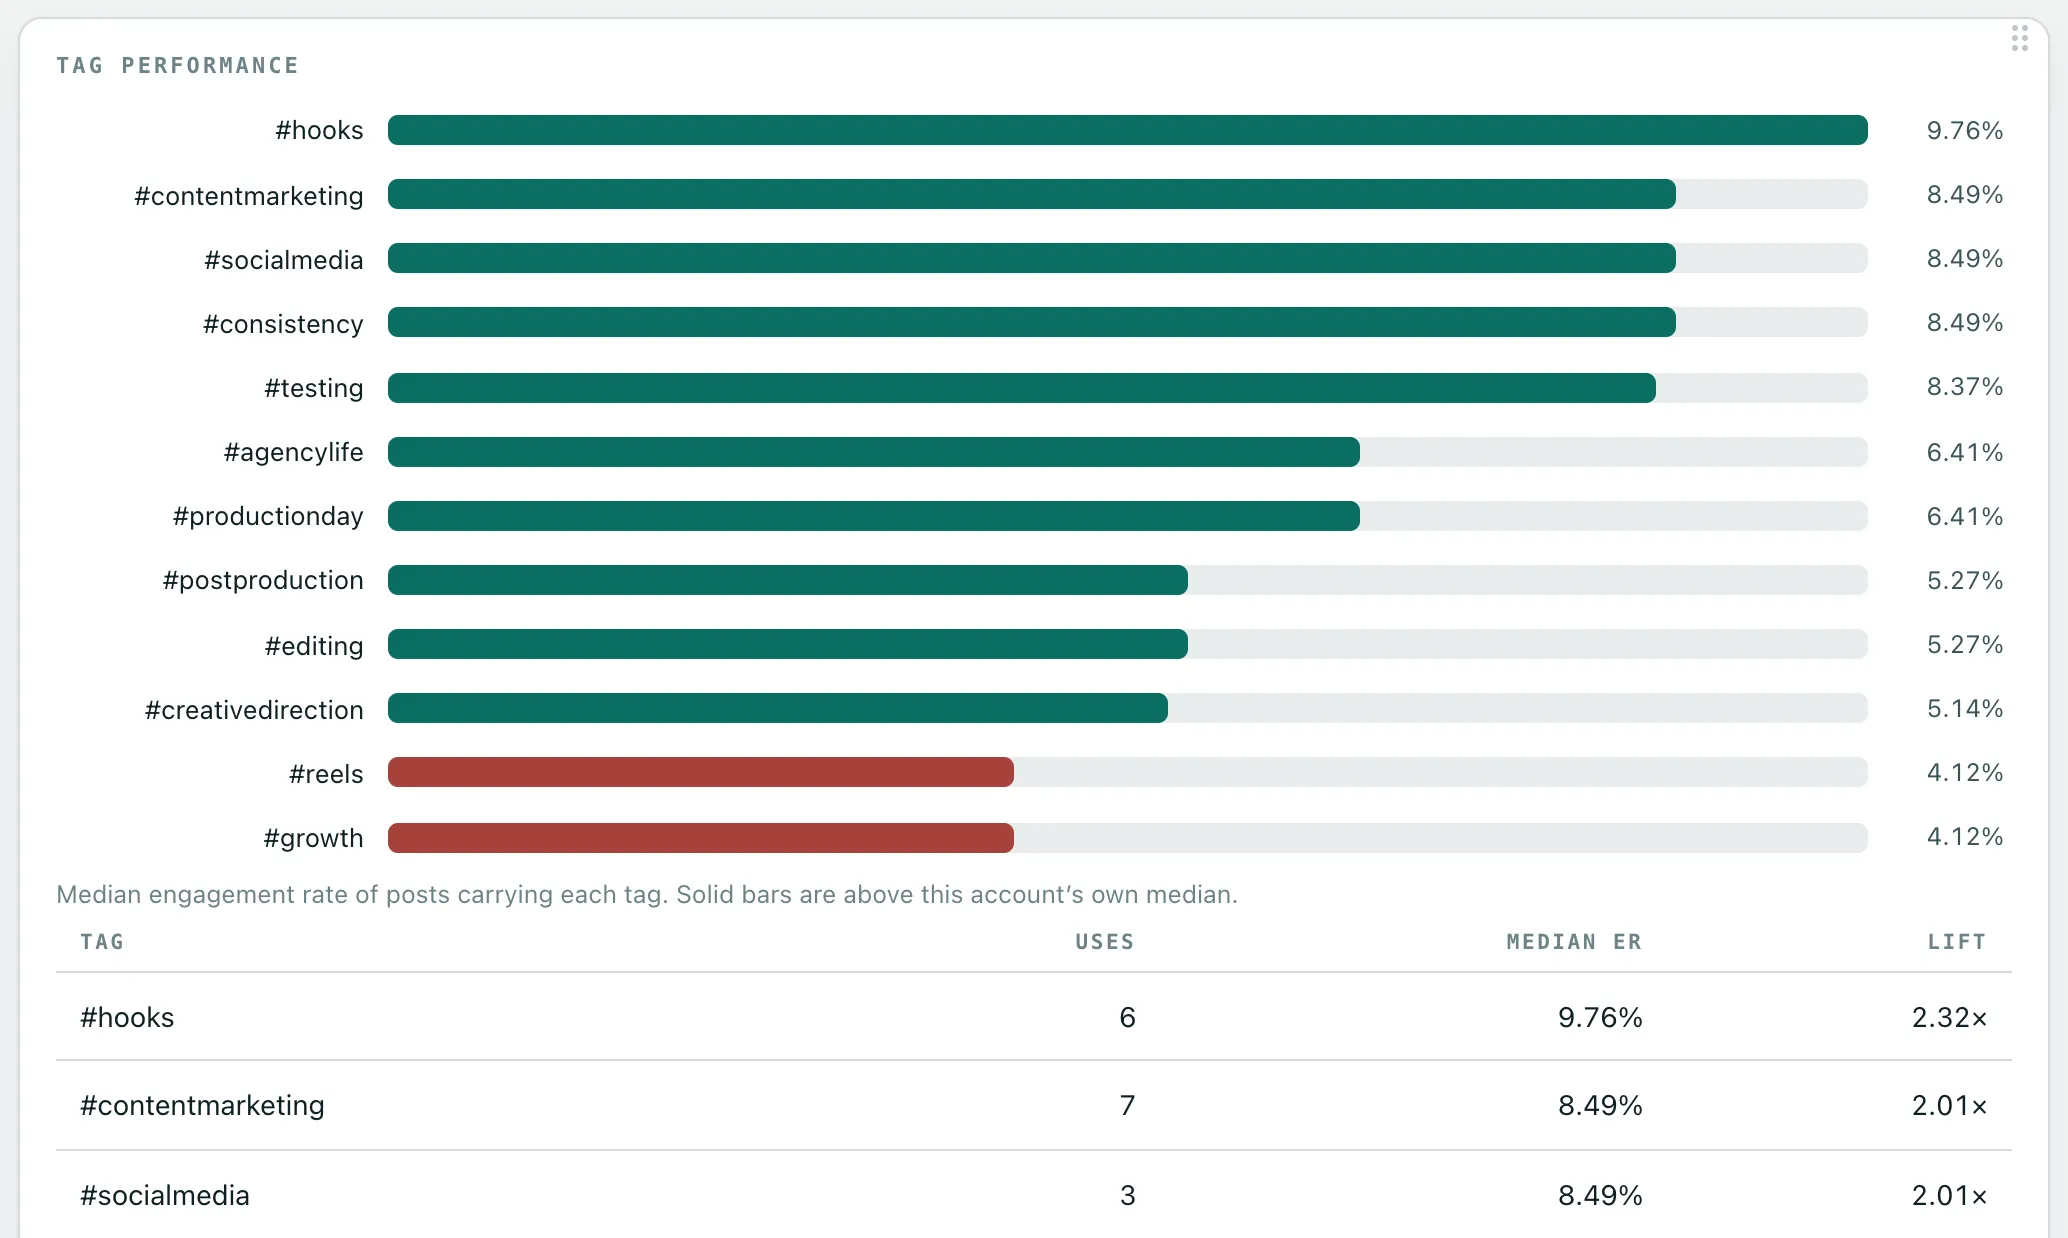
Hashtags. Which of your tags are carrying reach and which are decoration, measured on your own posts against your own median rather than a generic popularity list. -
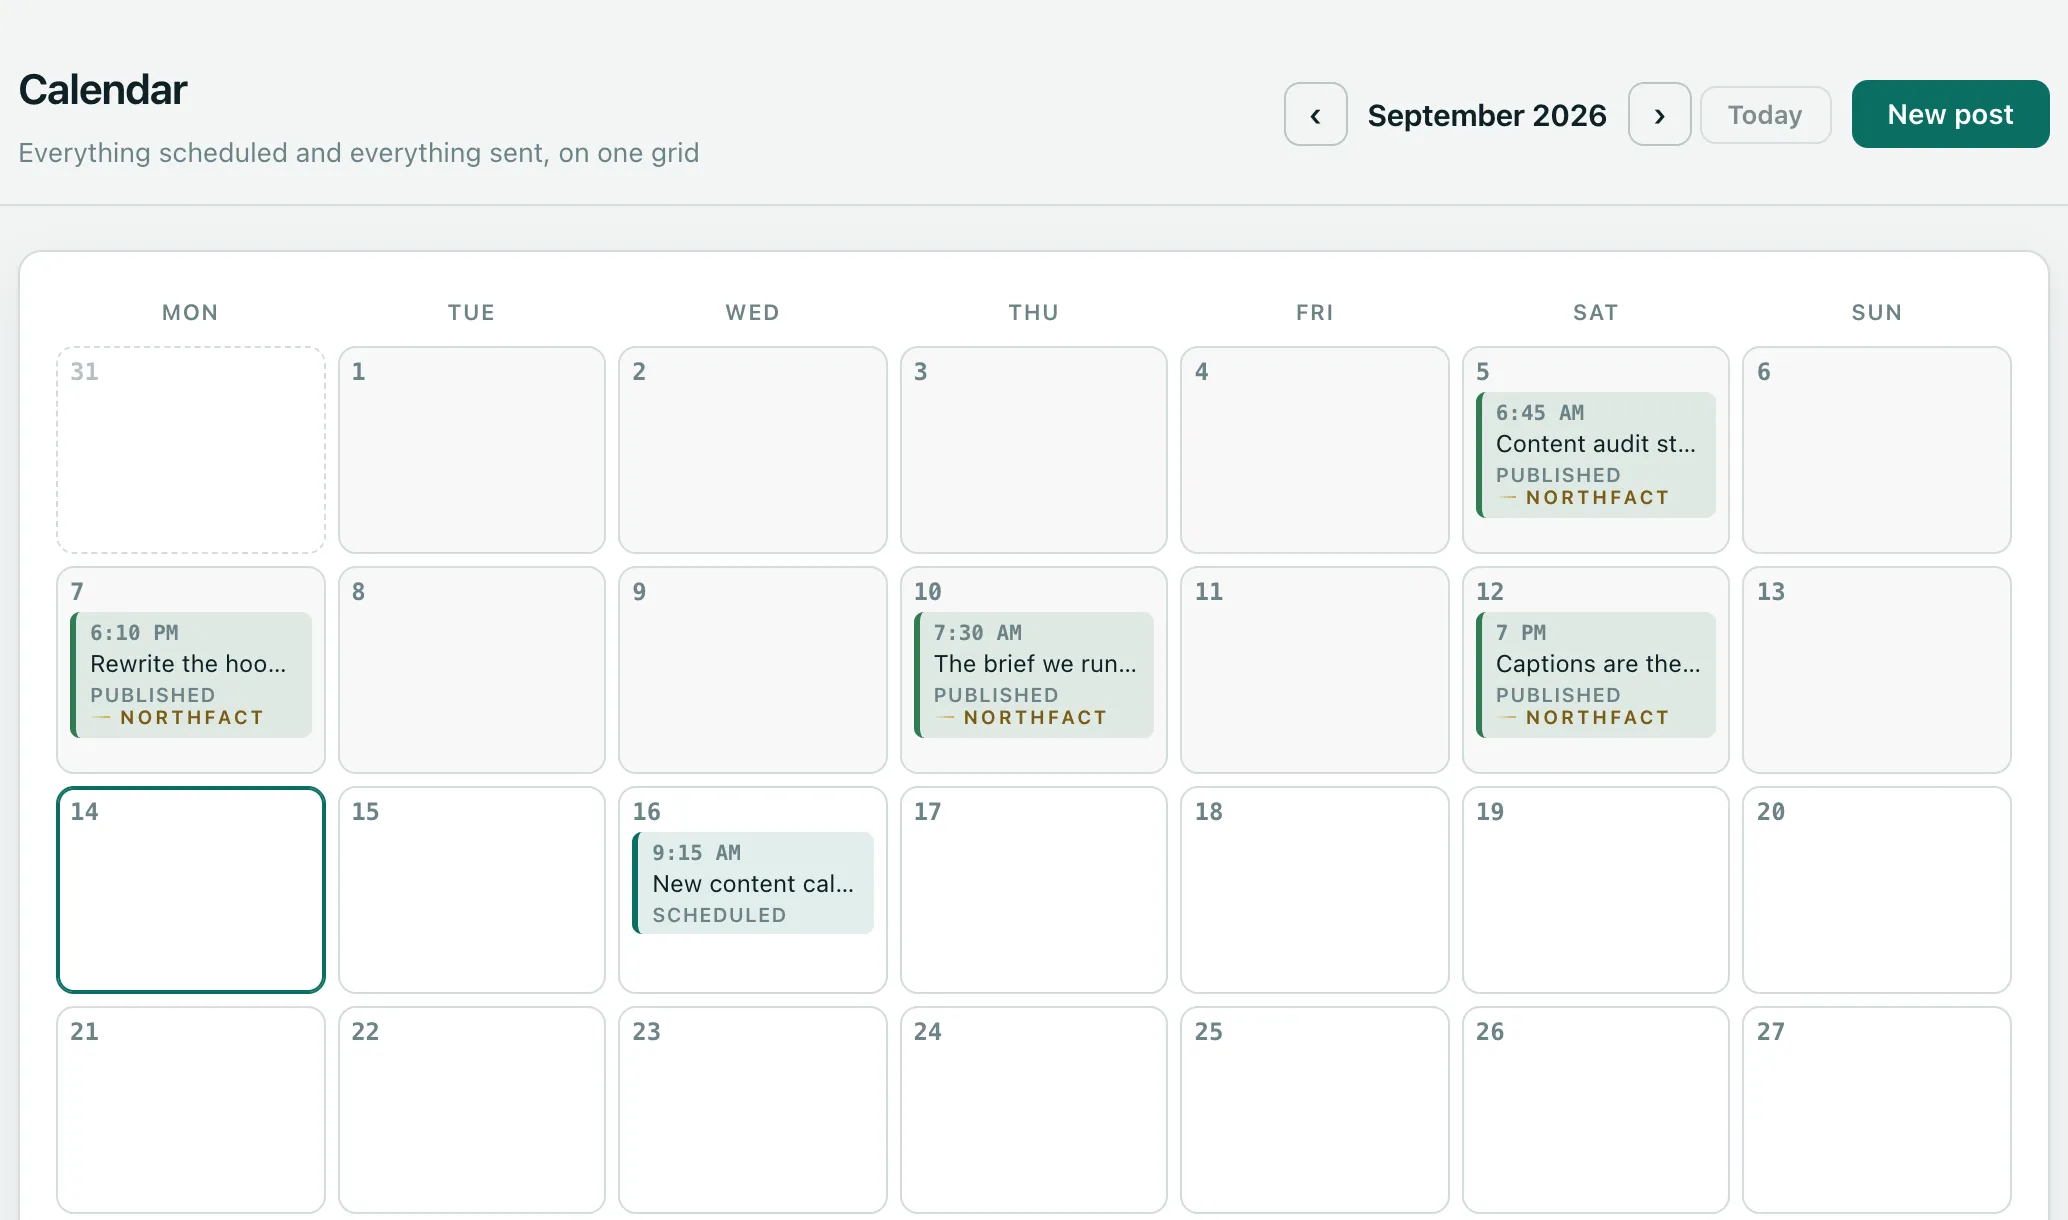
Calendar. Everything scheduled and everything already sent on one grid, so what you are planning next and what you published last month are the same view. -
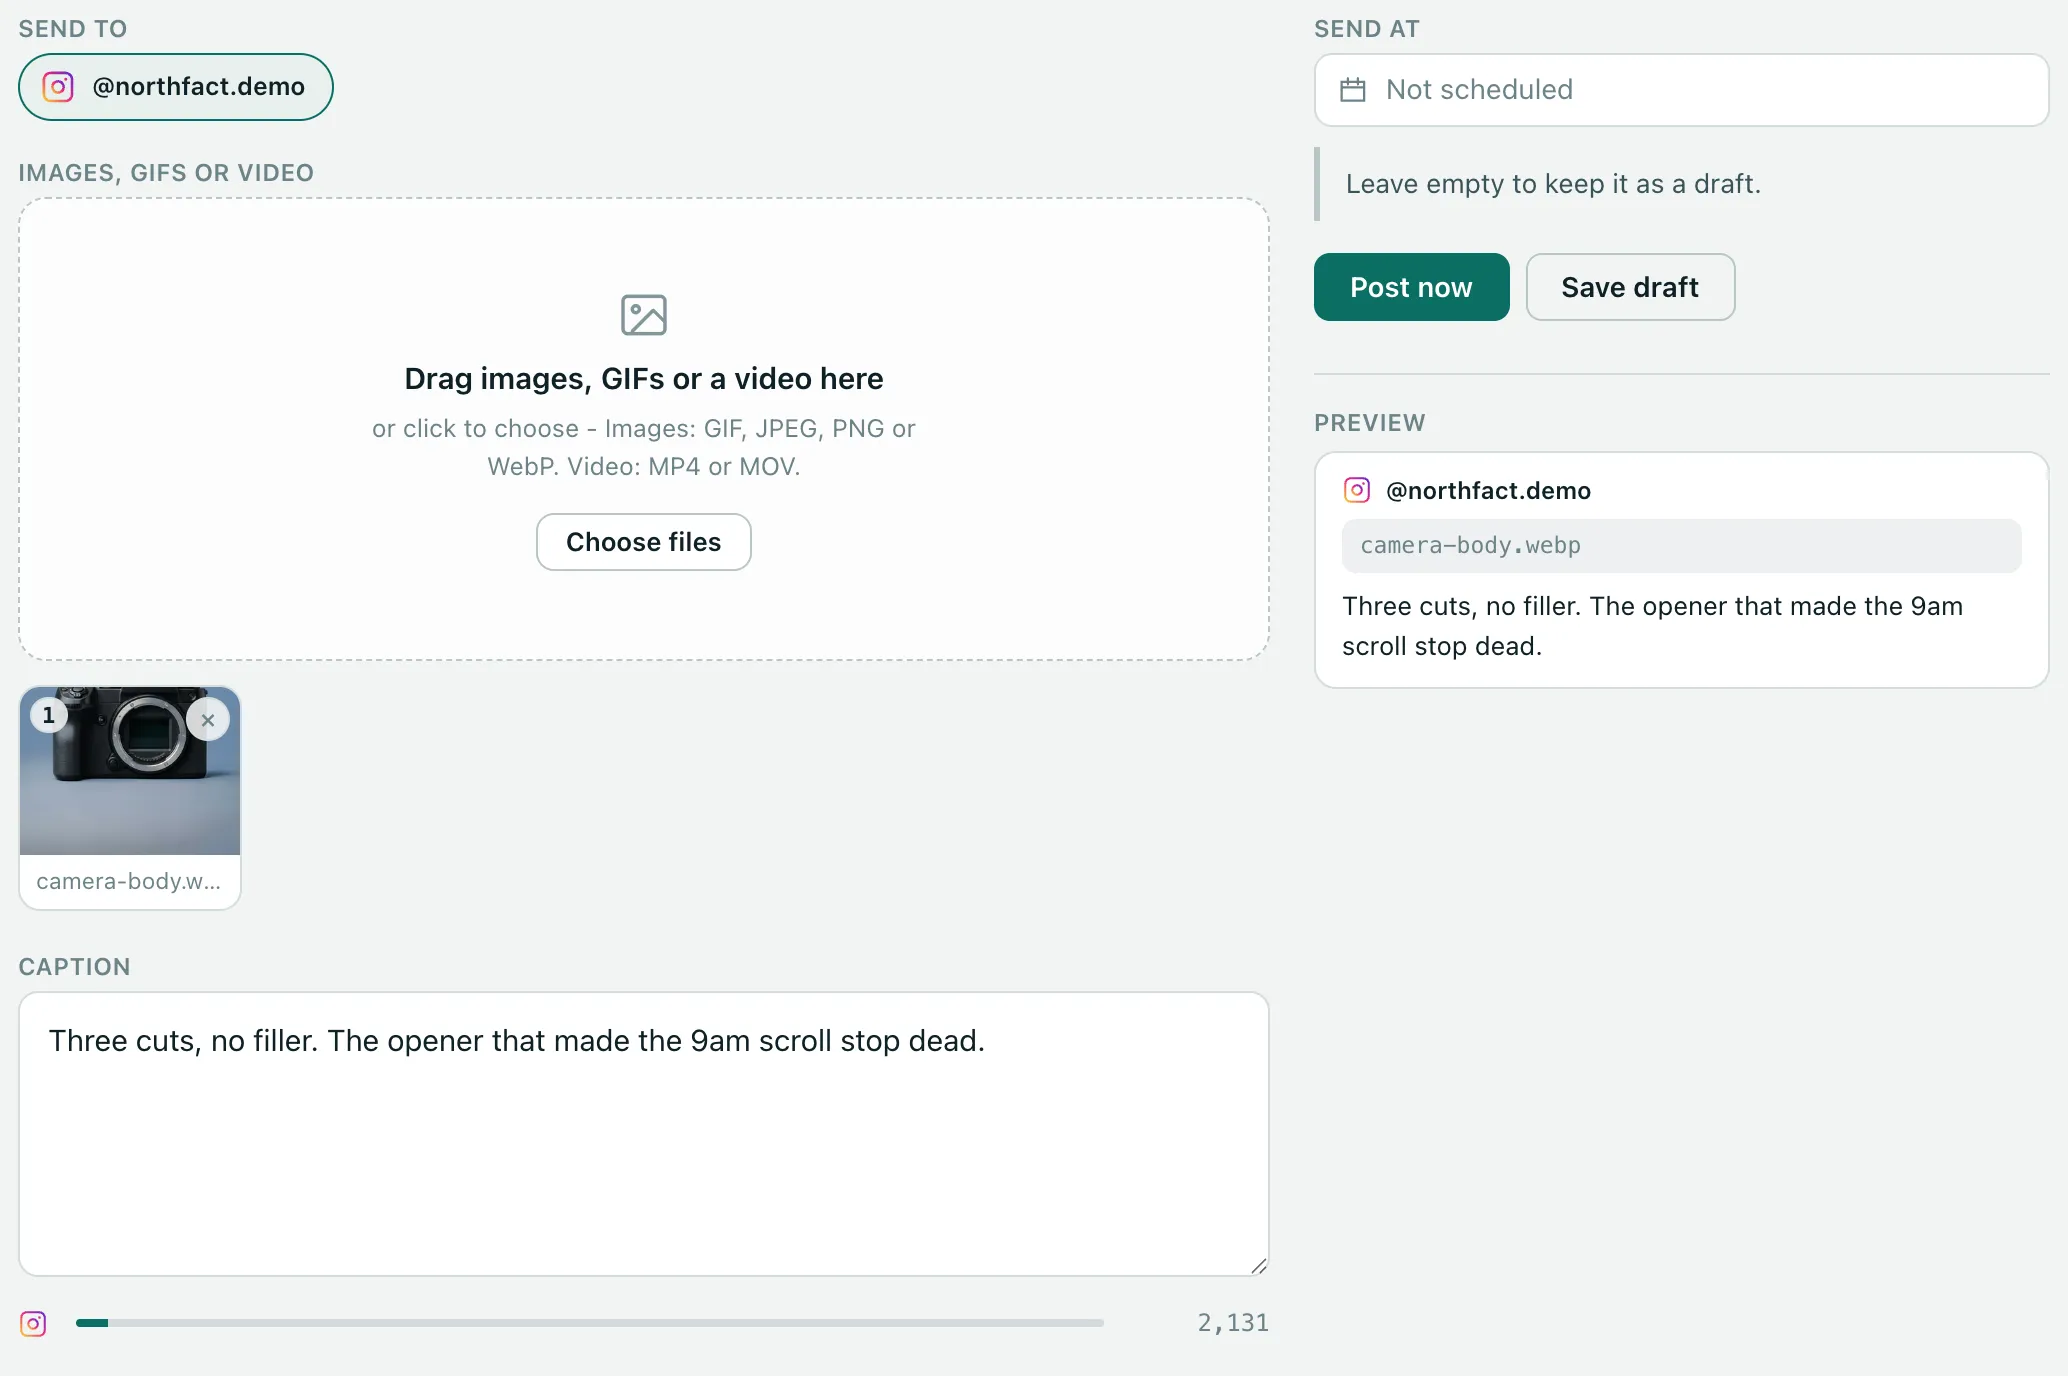
Compose. One box for every channel you publish to, with each channel's own rules checked as you type rather than after you press send.
Screens are the easy part. What matters is the rule every one of them follows. What it does
The rest of it, and none of it guesses either
Six things the workspace does, each held to the rule the section above just made: say what was measured, or show a gap.
Every number says where it came from
Every figure carries its source and what it was measured against - of reach or of followers - and a figure a platform will not report is shown as a gap.
- Two denominators, never mixed in one row
- A gap and its reason, never an estimate dressed as a measurement
Competitors measured like for like
Posting rhythm, format mix and engagement, on the accounts you actually compete with.
- A comparison only follower counts can make says so
- A row one side cannot supply is left out, not filled in
Reports you can send
A month of activity as a report that goes out as it is, every figure still carrying where it came from.
- To a client, to whoever signs it off, or into your own records
- Nothing in it has to be taken on faith
Hashtag performance
Which of your tags carry reach and which are decoration.
- Measured on your own posts, not a generic popularity list
- Lift read against your own median, not somebody else's
Schedule and publish
Plan a week in one view and queue it to Instagram, Facebook and Threads.
- Drafts and ideas live where you publish them
- The post goes out from here, which is what dates every figure after it
Audience quality
No platform hands over a list of who follows you, so this is an estimate and is shown as one.
- A share of a sample that looks inauthentic, with the signals that flagged it
- A range rather than a single figure, and never a named account
- No sample to draw on, and you are told that instead of given a score
A tool you already pay for does some of that. Here is the part it does not. Line them up
Schedulers post. Analytics tools measure. You need both to prove anything.
Publishing tools tend to report shallow numbers, and analytics tools can't publish - so the content and the evidence live in different products, and neither one can tell you why a post worked. That gap is the reason Northfact exists.
| Capability | Northfact | Schedulers | Analytics tools |
|---|---|---|---|
| Schedule and publish | ● | ● | - |
| Deep performance analytics | ● | ◐ | ● |
| Every metric shows its source | ● | - | - |
| Competitor benchmarking | ● | - | ◐ |
| Hashtag analytics | ● | - | ◐ |
| Reports you can send as they are | ● | ◐ | ● |
| Works with AI agents | ○ | ◐ | - |
| Free tier that does real work | ● | ◐ | - |
Weighing up a specific tool? Northfact vs Buffer, including the parts where Buffer wins.
Three channels work today. We would rather say that than list seven logos. What is live, and what is next
Where it runs today, and what lands next
We'd rather support a channel properly than list a logo. Three are working now, as of September 2026, and four are in active development. Below them is the work that is not a channel.
Client reporting and team workflow
Branded exports, shareable report links, scheduled monthly delivery, approvals and multiple seats for agencies running several accounts.
Organic and paid, side by side
Once the ad accounts are connected, spend sits next to the posts it promoted, so you can see what the money actually bought rather than reading the two reports separately.
AI agent access
Drive Northfact from Claude and other assistants - draft a week of posts, ask what changed since last month, and get an answer with its sources attached.
All of it is free while the beta is open. What it will cost
Free while we're in beta
No card, and no trial counting down in the corner.
Beta
Available- Instagram, Facebook and Threads
- Scheduling and content calendar
- Full analytics with provenance
- Competitor benchmarking
- Direct input on the roadmap
After the beta
- Pro Planned
- More channels and higher limits, scheduled report delivery, and AI agent access.
- Agency Planned
- Everything in Pro, plus a workspace per client, branded exports and team seats with approvals.
Neither is priced, because what belongs in them is still being decided by the people using the beta. Whatever they end up costing, the access you get now stays free.
Frequently asked
What is Northfact?
Northfact is a social media workspace that combines publishing and analytics. You schedule content to Instagram, Facebook and Threads, and Northfact measures how each post performed - reporting every metric alongside the source it came from and what it was measured against.
Which platforms does Northfact support?
Instagram, Facebook and Threads are supported in the beta as of September 2026. TikTok, YouTube, LinkedIn and paid ads are in development for phase two.
How much does Northfact cost?
It's free during the beta - no card and no trial period. Paid Pro and Agency plans will follow once the beta has shaped what belongs in them, and everyone who joins the beta keeps their access.
How is this different from a scheduling tool?
Scheduling tools are built to get posts out of the door, and their reporting usually stops at likes and comments. Northfact treats measurement as the main event: competitor benchmarking, hashtag performance, audience quality and reports you can send are part of the product rather than an afterthought - and they're attached to the posts you published from the same place.
What does "every metric shows its source" mean?
Social platforms expose different data depending on how an account is connected. An engagement rate measured against reach and one measured against follower count are different numbers, and most tools present them identically.
Northfact labels each figure with where it came from and what it was measured against - and when something genuinely isn't available for a post, it says so rather than substituting an estimate. That's what makes a report defensible when anyone asks where a number came from - including you, six months later.
Can I see which of my followers are fake?
Not account by account, and be wary of any tool that says it can. No platform API returns a list of who follows an account, so every audience quality score - ours included - is estimated from a sample of the accounts that interact with you, not read off a follower list.
What you get is the share of that sample that looks inauthentic, as a range rather than a single figure, together with the signals behind it. When there is no sample to draw on, the workspace says so rather than scoring you anyway.
What do you do with my data?
Your account data is yours, kept isolated per customer and never sold or shared. We store the minimum needed to produce your reports, and you can ask us to delete everything at any time.
How do I join the beta?
Enter your email above and we'll send an invitation as places open. Beta testers get free access and a direct say in what gets built next.
Help shape what this becomes
We're opening Northfact to a small group first. Tell us where your current reporting falls short and we'll build toward it.